Kubernetes Dashboard
You can use the default Kubernetes dashboard to monitor your confidential applications. For an application-orient view, you can use Kubeapps. For a performance-oriented view, you can use TEEMon.
Prerequisites
- A Kubernetes cluster
kubectlis properly set up
Installation
Install the dashboard with kubectl:
kubectl apply -f https://raw.githubusercontent.com/kubernetes/dashboard/v2.7.0/aio/deploy/recommended.yamlStart the kubectl proxy:
kubectl proxyThe dashboard can now be viewed at:
You need a token to use the dashboard. You can create the token to be able to log into the dashboard as follows:
- Create a Cluster Admin service account (if you have not done so)
kubectl create serviceaccount dashboard -n default- Add the cluster binding rules to your dashboard account
kubectl create clusterrolebinding dashboard-admin -n default --clusterrole=cluster-admin --serviceaccount=default:dashboard- Get the token
kubectl get secret $(kubectl get serviceaccount dashboard -o jsonpath="{.secrets[0].name}") -o jsonpath="{.data.token}" | base64 --decodeApplication Monitoring
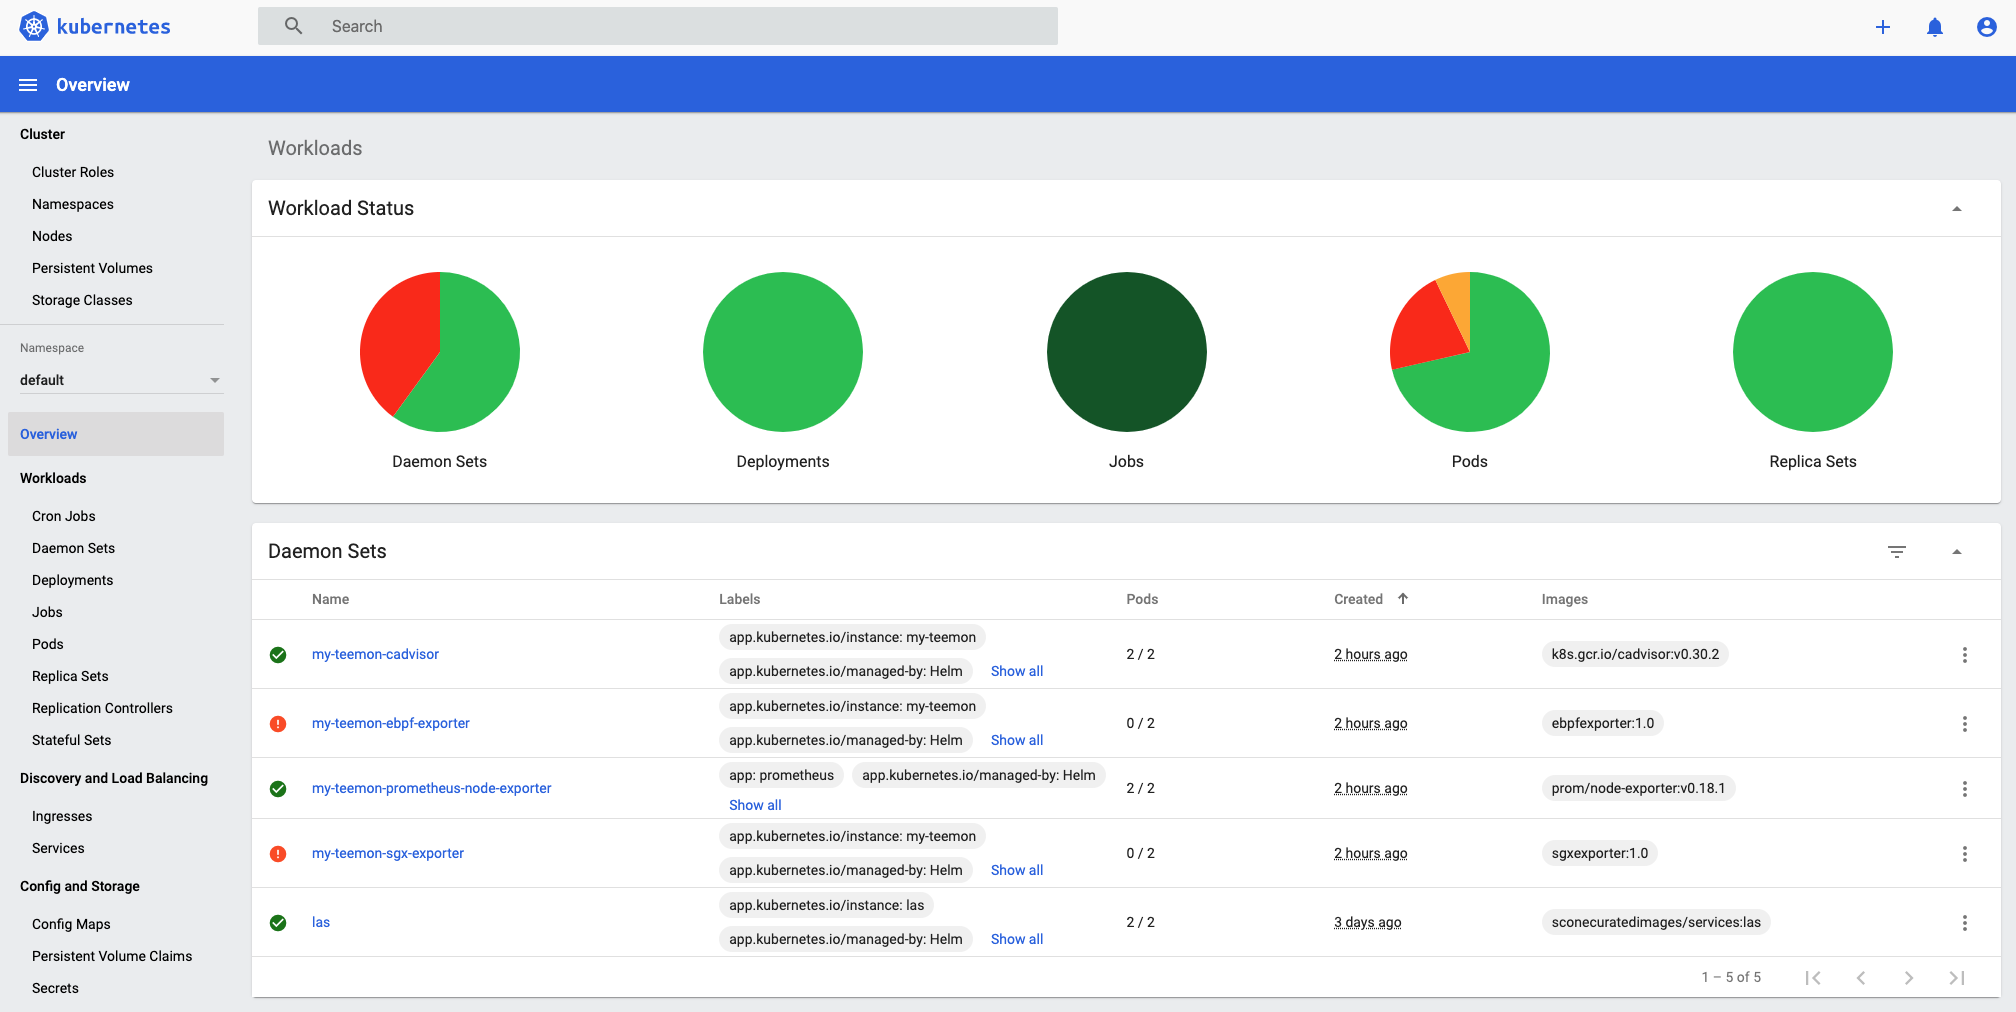
In the Kubernetes dashboard you can monitor various workload characteristics and identify issues in the workload. Like in this case, some services did not start:
